While I’m working on the next angle on how to speed up calculating similarities I started investigating how to get better telemetry from cookit. Getting telemetry is easy - making sense of it is the hard part. This also brought another pain point of current setup - logging and monitoring. Since cookit is my pet, nonprofit project it was time to do something.
TL;TR;
There is a comparison table at the end, and what I’ve choose.
Table of content:
- The current state of logging and monitoring
- Requirements
- The showdown
- Comparison table
- What I’ve choose.
The current state of logging and monitoring
The current setup is based on:
- NLog - used for almost all logging in the website and in the Windows Service (You can read more about cookit architecture here). Most errors are logged into files, the critical ones are emailed to me.
- Hangfire dashboard - for checking job status and if it ended with a failure. If it crashed, only the main exception is displayed.
- Remote Desktop - for troubleshooting, performance counters and all monitoring stuff (trust me I know how badly RDP and monitoring placed in one sentence sounds :( ).
Except for the last one the setup was more or less OK on the daily basis. But in more advanced scenarios it started lacking more and more:
- email notifications are fine for being informed that something is wrong, but for the details, I have to RDP and see the files and this is tolerable only on a PC. Doing this on a tablet or a phone is wasting time. Another problem is that if something goes wrong I get thousands of emails.
- no performance metrics except for the Hangfire dashboard.
- since I am running cookit on crappy hardware RDP is slow.
- any analytics or finding correlations had to be done manually. Doing it this way is a pain and a waste of my time.
- no way to do a post mortem why the site was slow an hour ago. The only source are the NLog files.
Requirements
So what I wanted to achieve (in order of importance):
- Visualizations. - Yes, this is the first place. Looking at tables is the worst way to get a glimpse of what is happening. A simple chart makes a huge difference.
- Accessible everywhere. - This means o need to RDP or any app that has to be installed. It has to be web based.
- Not running on my machine. - Every system needs some taking care of it. Checking the logs once in awhile, upgrading to a newer version and so on. This requires time and knowledge (knowledge can be translated into time needed to have it). For the current moment this is not the area where I want to invest my time, so SaaS it is.
- performance counters of the machine. - Knowing the stats of the application without knowing the stats of the whole machine is close to pointless when things go haywire.
- Centralized logging. - No more digging through multiple NLog files. It has to be in one place.
- Custom events. - I want to add custom timings for each TPL Dataflow block that I am using in data processing workflows. Also seeing aggregated timings of Hangfire jobs would be nice and would show me where to invest time in optimizations.
- Real-time. - when I get a report from Pingdom that the site is not responding I want to check what is happening right now on the machine. Hour old data, in this case, is no use.
- Alerting - Having monitoring without alerting works only when you can have huge monitors displaying the dashboard in a room filled with people dedicated to monitoring one app. Even then it only works in movies. Alerting is a must have and a time saver.
- Historic data. - The time between getting an alert and having time to look at it is almost always non-zero in my case. Having at least 8 hours (remember, sleep is a good thing?) of data is a must have.
The showdown Google Analytics vs. ELK +Graphite/Grafana vs. NewRelic vs. Retrace vs. Application Insights vs. Raygun vs. Datadog:

Google Analytics
Google Analytics is way more than SEO/SEM tool. With the support of custom client and server events, it can be turned into monitoring tool. Another plus for using it is that I have it already and are looking at it from time to time.
The good
- good/decent visualizations
- very good UI (fast and intuitive)
- accessible everywhere
- free (at my scale)
- I already have it
- has custom events
- monitors browser performance
- supports custom client and server events
- has custom dashboards
- good Android application
The bad
- working with custom events is not that great
- no collection of system performance counters (can be easily written, but still a minus)
- no log aggregation
- no alerting

ELK Stack + Graphite/Graphana
ELK stack with Graphite and Grafana is the market standard for monitoring and central logging. This means that it is very easy to find Docker images, help and almost everything what is needed. Viewing on mobile devices is possible, but far from being great, and this won’t change anytime soon judging from this Github issue.
Grafana panel: 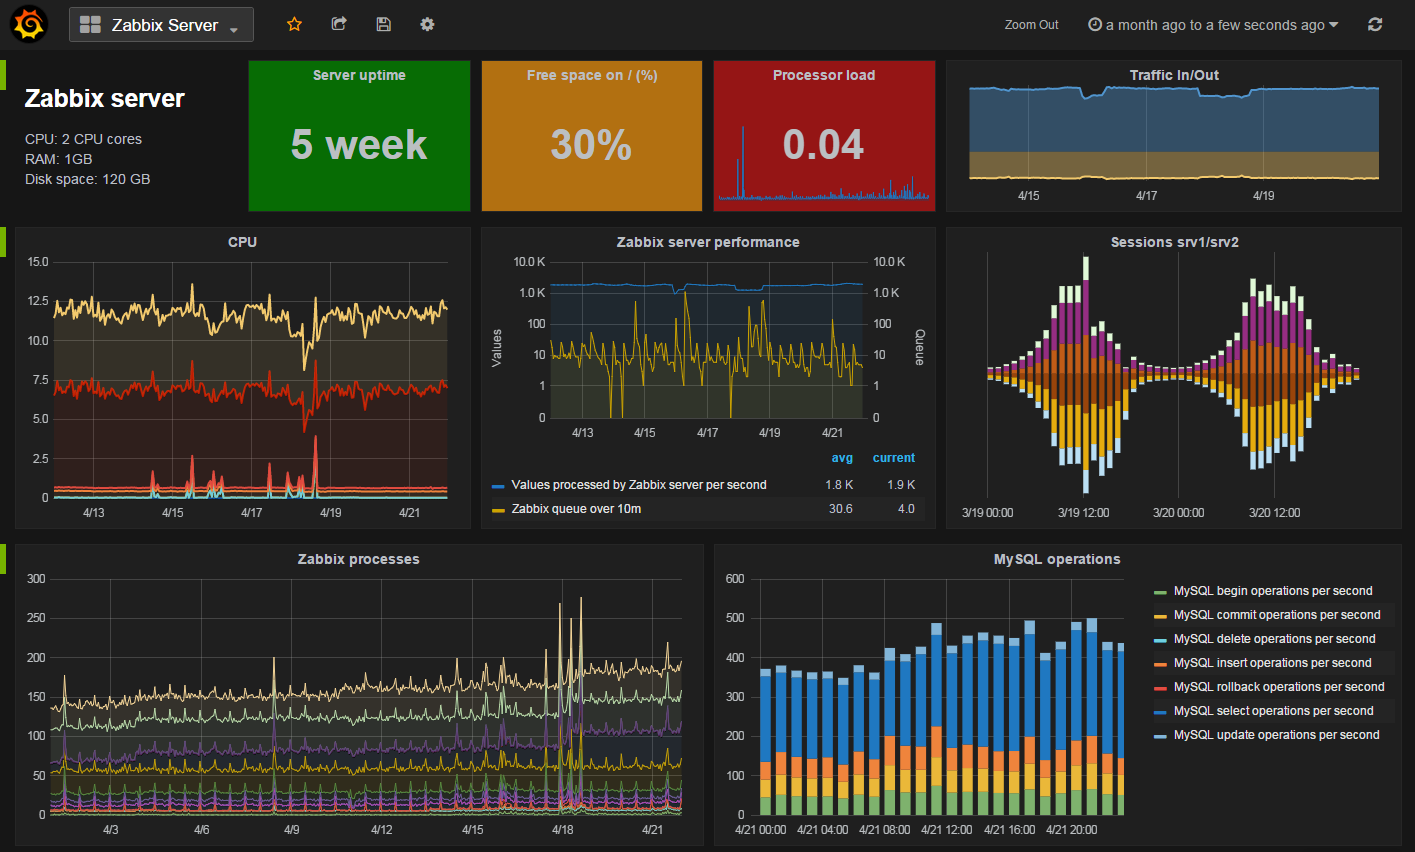
Kibana panel: 
The good
- the market standard
- great visualizations (both Grafana and Kibana)
- great data crunching tools
- there are some ELK SaaS providers.
- great UI and visualization
- web based
- there are existing applications for server stats monitoring
The bad
- mostly Linux based and since I am running on a Windows Server this meant getting another Linux machine. Setting every
- most providers are not free
- a lot of stuff to manage on my own
- no out of the box monitoring

New Relic
New Relic is a power horse when it comes to features. It has almost everything, from APM (Application Performance Management) to log aggregation. It is a very interesting product since it is done in a way that will be readable to nontechnical people. It automatically sets up notifications for apdex index violations, the UI is orientated into showing the main KPI for performance (like Google Analytics), not tech details like for example Azure Application Insights (next)
The main dashboard: 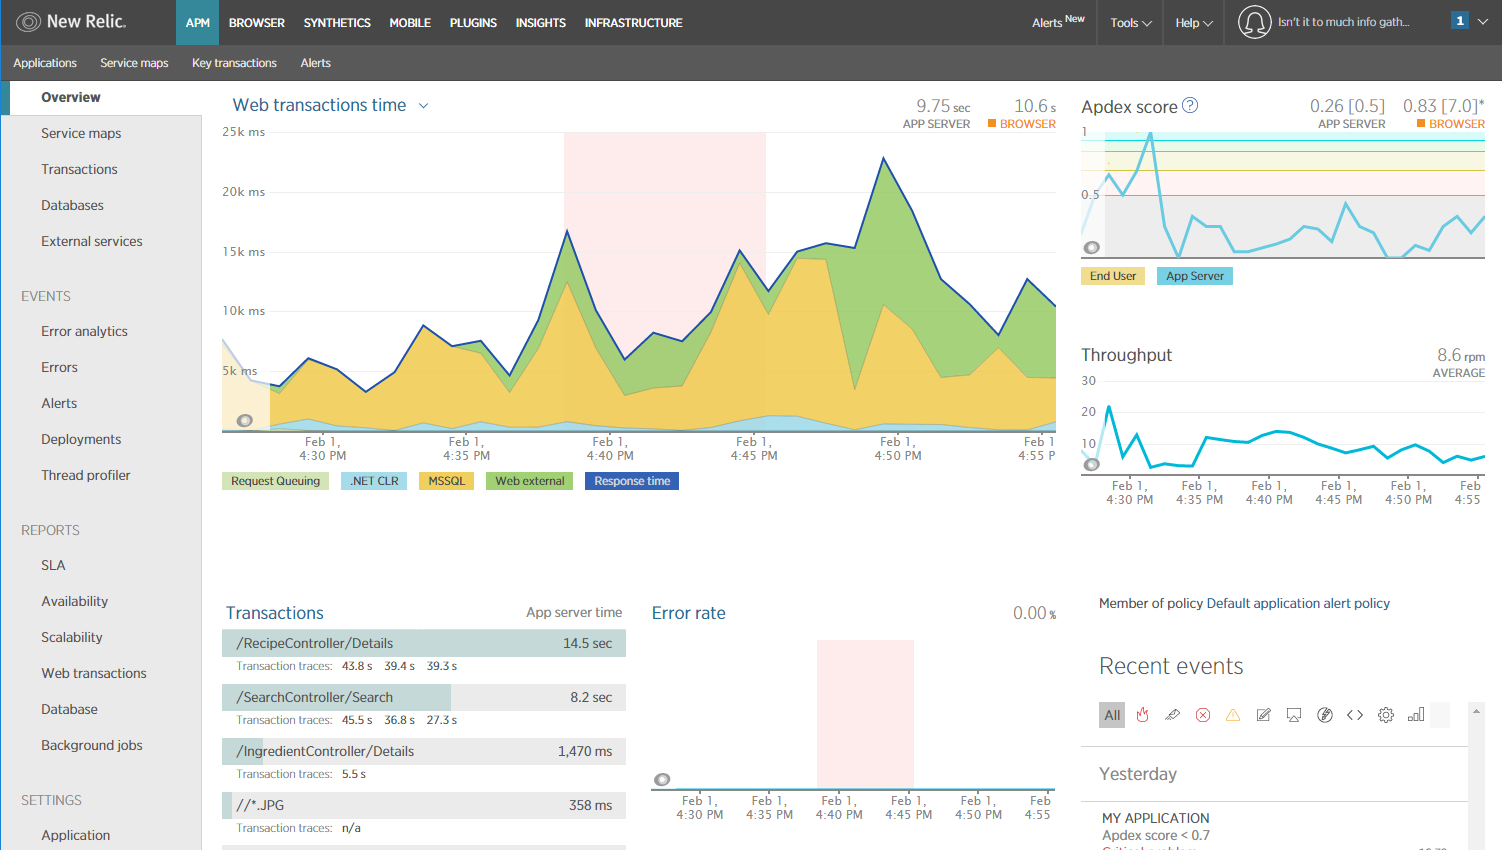
I was quite impressed with how good New Relic inspects what went into each request. This is the Request monitoring page: 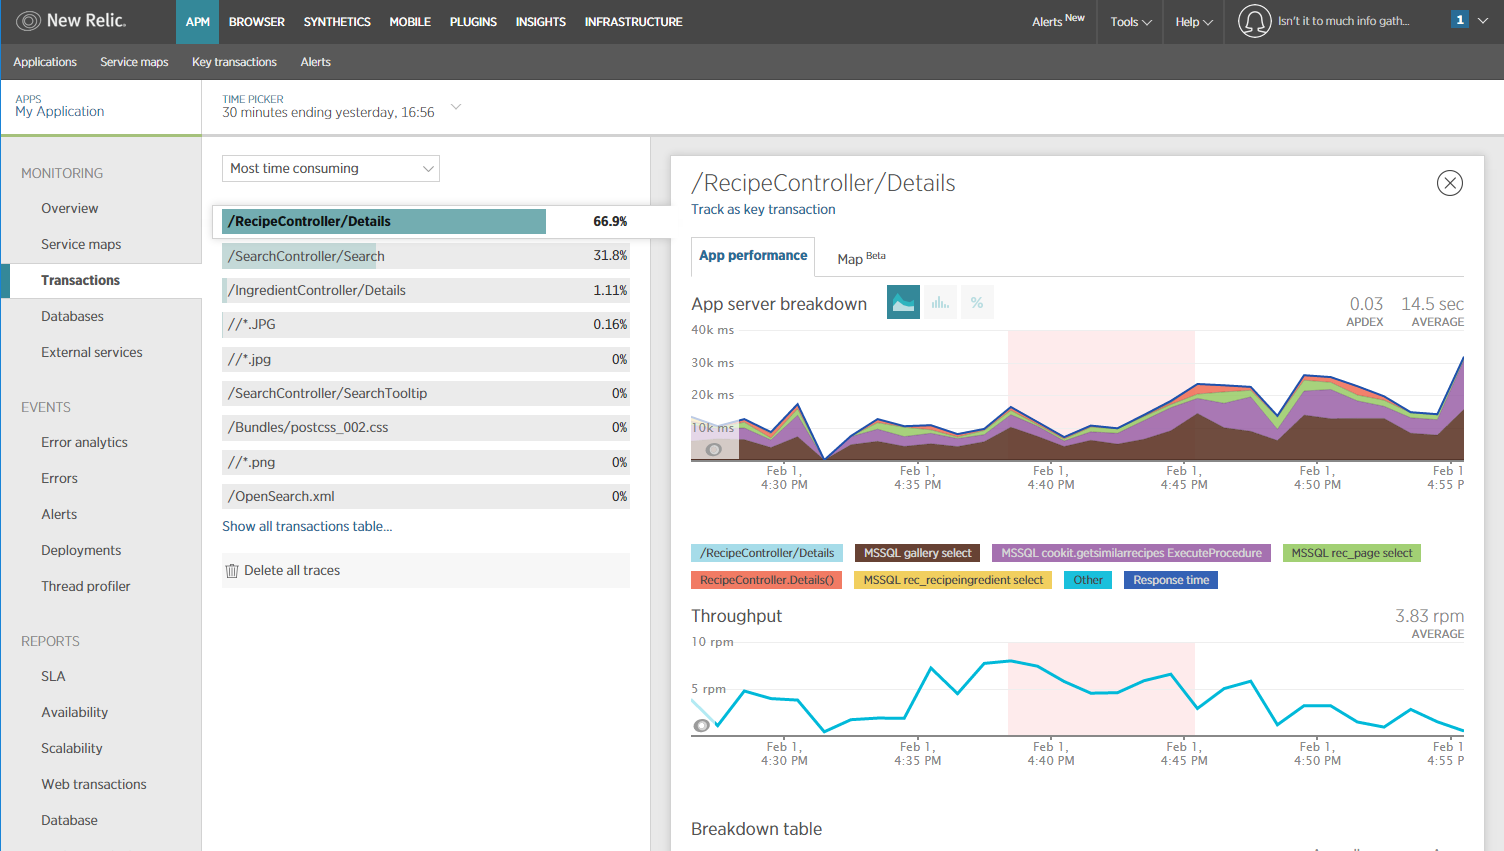
Another thing that is a nice feature, and very unique, is the Geo View. It shows how page speed differs for different geo locations. And as You can see I have a problem with Russia (I have no idea why): 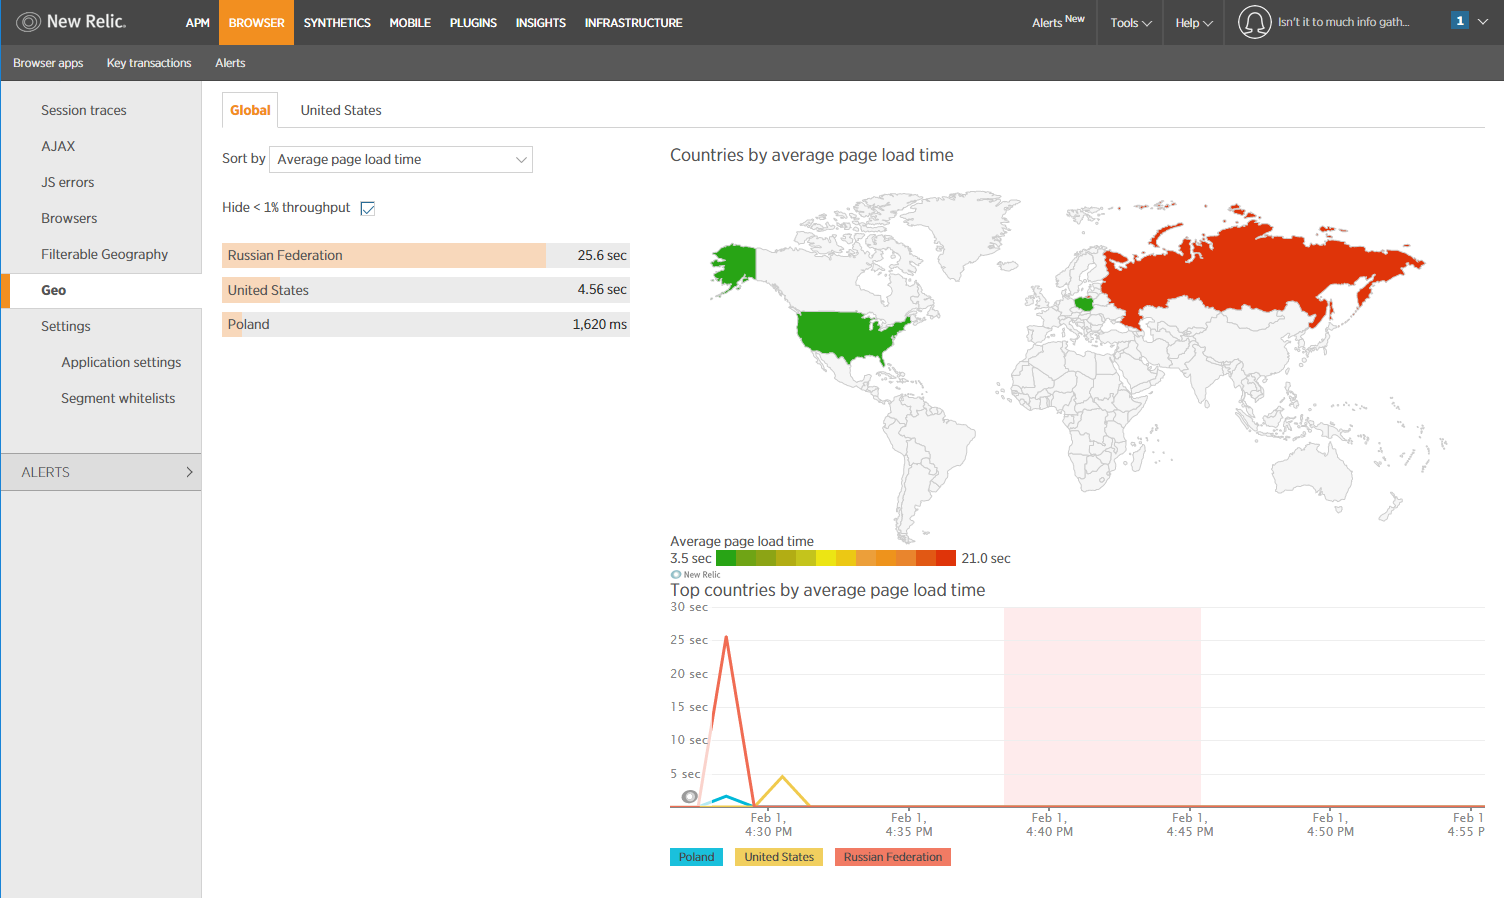
Installation is the easiest of all reviewed. All that is needed is to install the NewRelic Agent on the server. Dependencies detection, metering, even browser performance tracking works out of the box.
One last thing to mention, and it may be subjective. I had the impression that after installing the NewRelic’s agent on the server it slowed down a bit. I could be due to the fact that Application Insights was also running on it, or that my machine is just slow as it is. If someone else also has this impression ping me.
To sum up - New Relic is a powerful beast with the looks that a manager can understand :)
The good
- out of the box monitoring of .NET, Ruby, Node.js, PHP, Java, Python and Go applications
- Supports web and non-web applications
- Supports browser monitoring
- fast and very good UI
- Browser profiling works without the need to add a script (it is added automatically by the installed NewRelic agent)
- very easy to install
The bad
- only paid version (I get why they have only a paid version. This is a minus for me when choosing for this use case. Remember this is a personal review).
- it consists of multiple products, and even when in trial mode, enabling some of them requires contacting the sales department.
- every sub-product is separately paid.
- at registration(demo) requires the phone number, company name, company size, and role.
- uninstalling requires a machine reboot.
- expensive
- confusing pricing

Retrace (Stackify)
Retrace is a product from the same guys (and girls) that developed Prefix - a good local profiler. I must say I was impressed by the features and polish that this product has. The UI may not show it fully, but it is not that far away from the big players. In some features, it’s even way ahead.
Retrace panel: 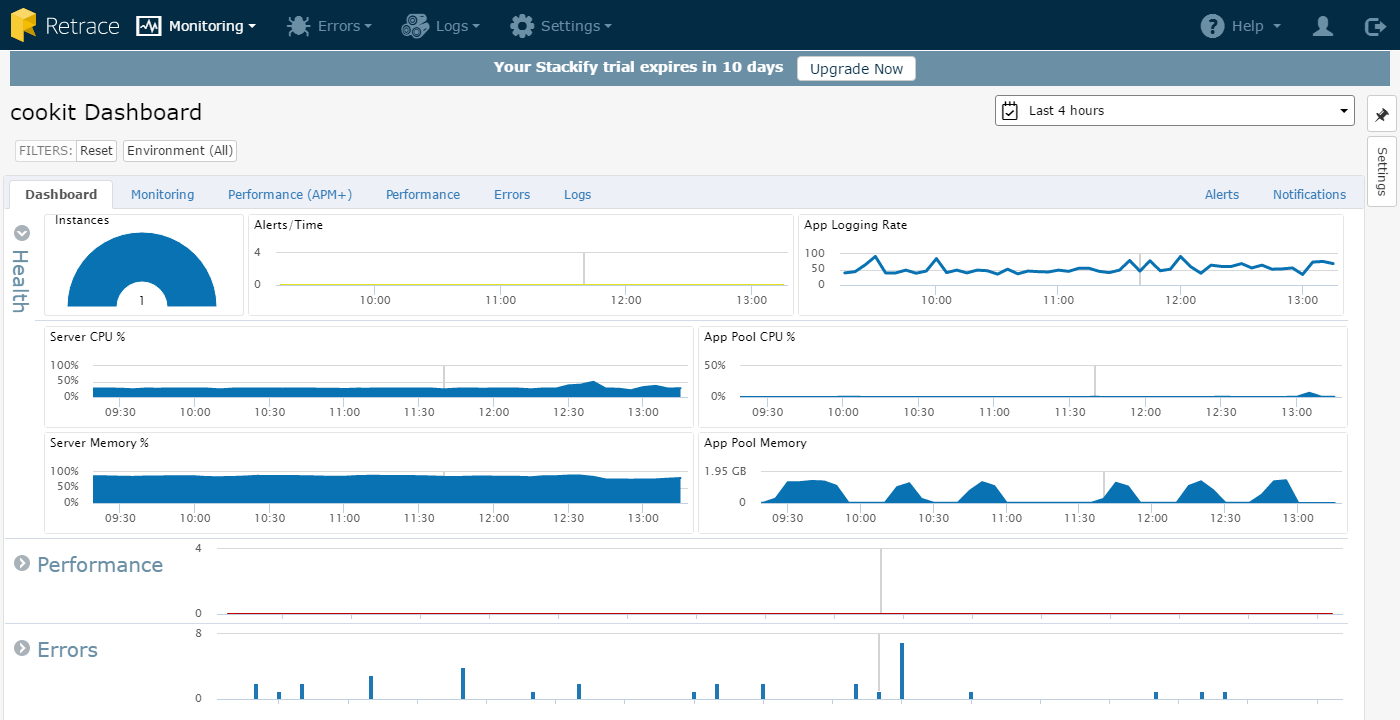
Retrace APM+ panel (from a demo application they provide. I was not able to get it working on my project): 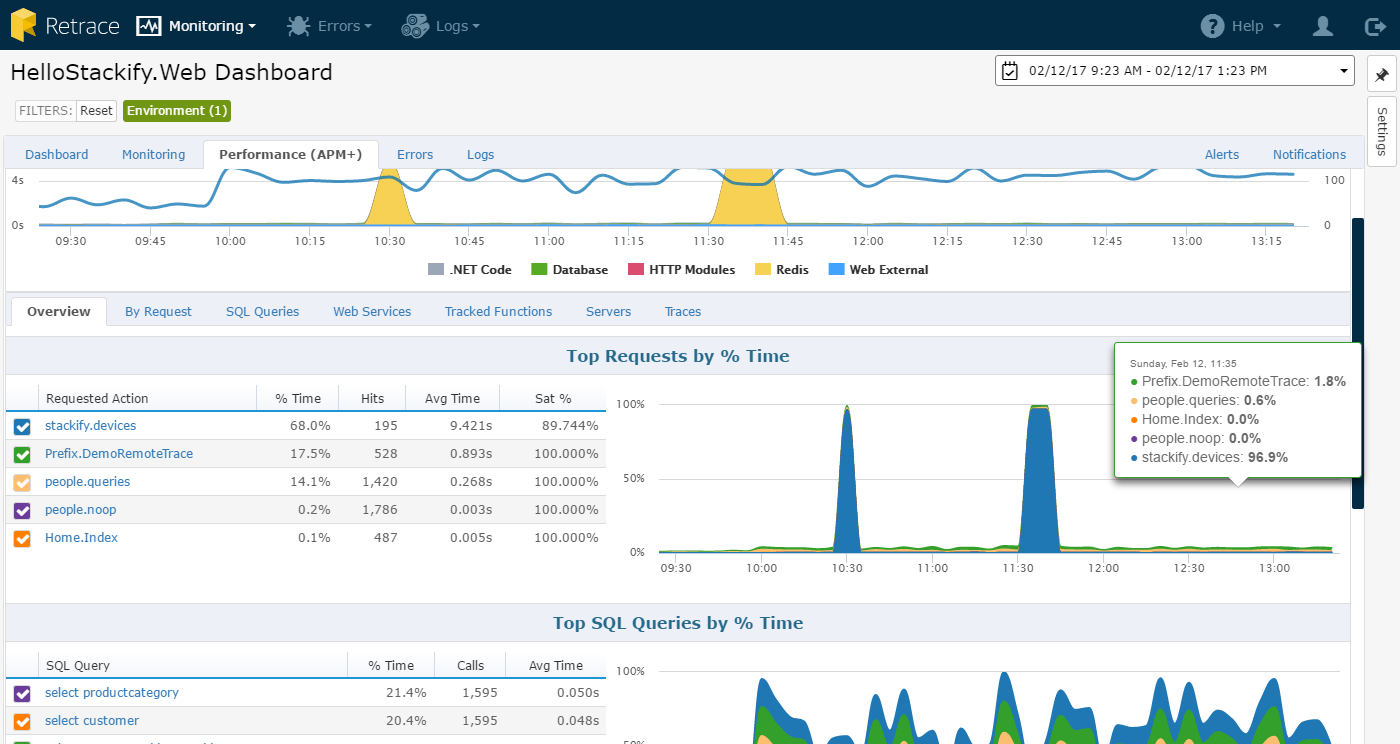
The good
- registration initially requires only Name, Surname and email are required 👍. Unfortunately, after email verification they want the rest 👎
- what is being collected by the agent is controlled from the website. So after installing the agent on the server, no additional work on the server is required.
- nice attention to details - when installing the NLog adapter we are prompted for the key.
- the best out of the box alert triggers from them all. The only system monitoring disk queue length.
- machine performance alerts are correlated with requests to the application.
- fast full-text search and data analytics for logs
- option to mark an error as “fixed”
- quite fast UI
- very good email alerts. They look good and are very informative.
- very good customer service :) (emails and the comments)
The bad
- after verification, they want a whole lot of info
- I was not able to get any APM+ statistics. Everything looked properly configured, but it did not work.
I've emailed the support, but no answer (granted it was on the weekend)Support contacted me just after the weekend and is very helpful, but we were not able to get it working. - Dashboard page is in beta, so it doesn’t have that many features or great looking as Application Insights or New Relic.

Application Insights
Microsoft is investing heavily in its Azure cloud and it can be seen from the number of features they are rolling out every three months. They are investing more in the SaaS model and Application Insights fits quite good in this environment. Application Insights feels a lot more developer orientated platform than New Relic. It can bee easily seen that they thought more about query capabilities (AND, OR operators), inner request details, features than in how to get the visualizations super nice.
My customized main dashboard: 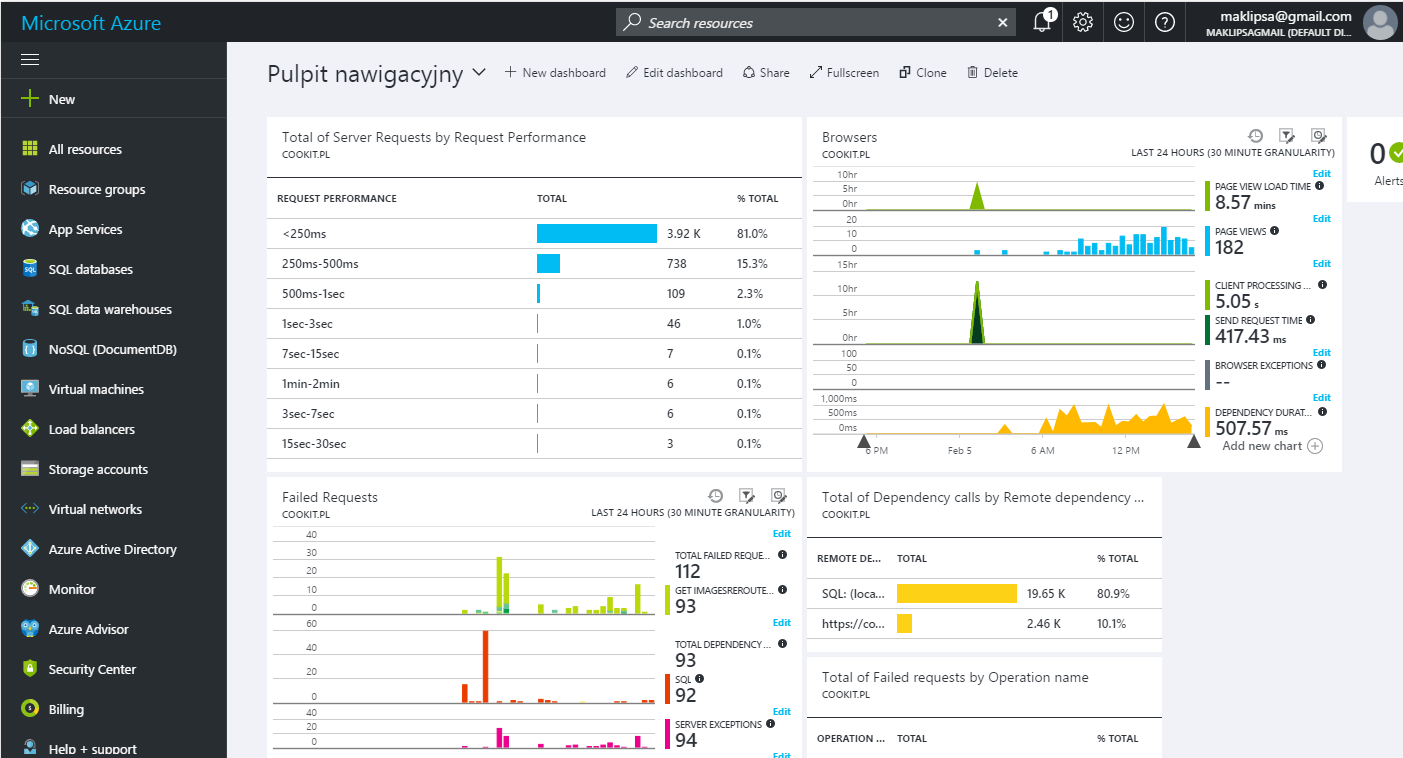
And the request details: 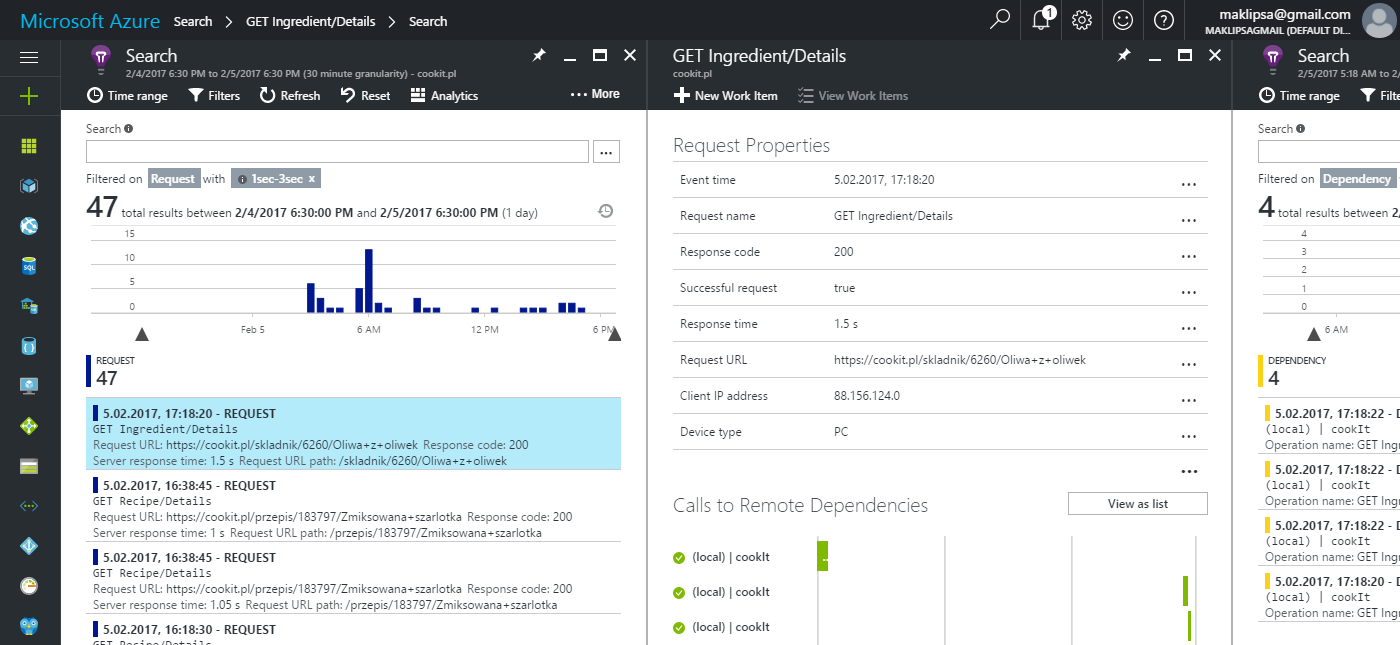 As you can see all dependencies were detected neatly.
There is also one thing that strongly shows that Application Insights is targeted at IT specialists. By clicking Analyze in the top bar we can see the query behind every diagram, change it and use it for a custom report. The language used is very similar to F#. This means we have all the functional goodies like piping and support for data manipulation functions. As a person using F#, I must say “well done Microsoft”:) 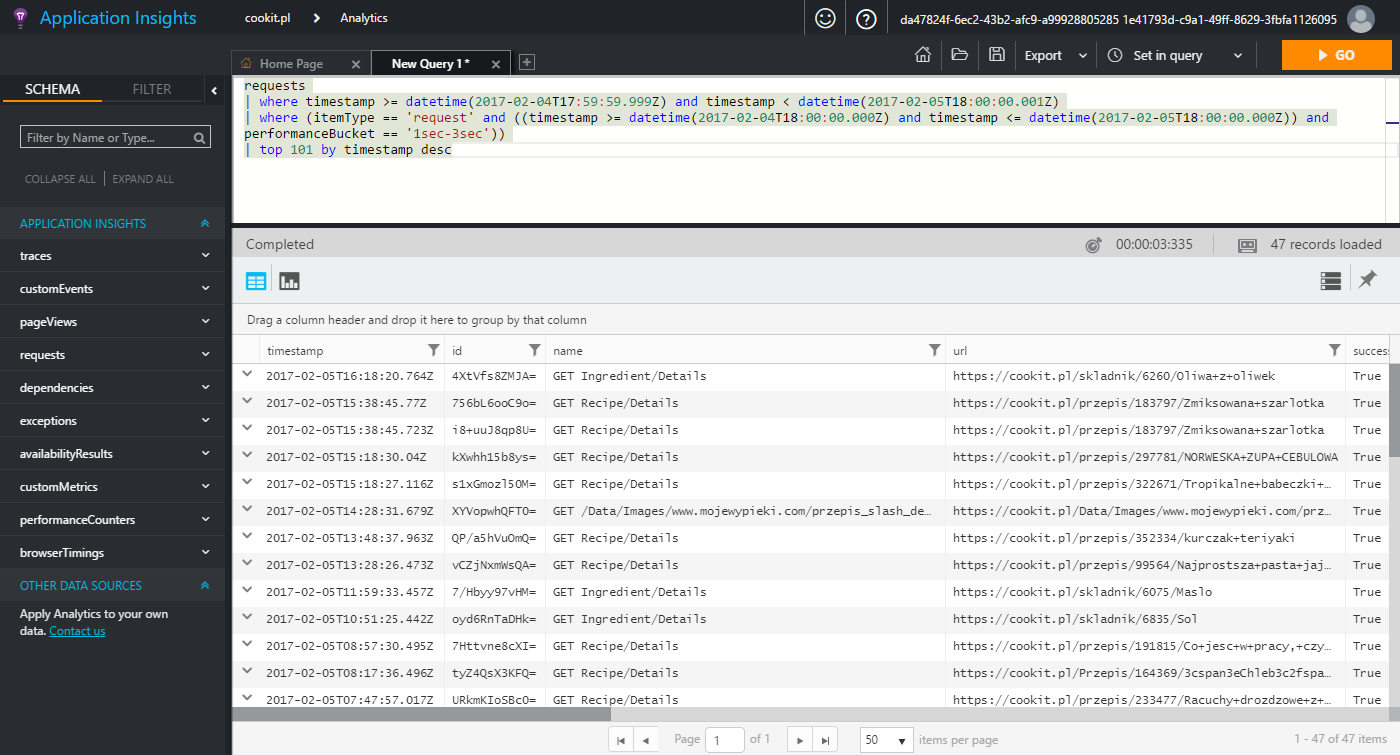
The good
- out of the box monitoring of sewer and browser (needs adding Google Analytics like script).
- can be added without access to the code. This does not allow full capabilities (dependency tracking and performance monitoring is available), but most of them.
- auto detected dependencies like HTTP requests and ADO(SQL) queries.
- 1 GB a month free.
- has data limits.
- has data sampling.
- very good search build in Azure portal. It searches in products and instances of products. This is more important than one might think because the number of screens is massive. Even when counting only those in the Application Insights module.
- customizable dashboard for every Azure offering (every panel can be moved to the main dashboard).
- the top bar displays connected features. When you open the pricing window it displays a link to the data limit window.
The bad
- detection of application map did not work that great with Oracle database (this may be a configuration issue, I haven’t had time to investigate)
- UI can get sluggish sometimes.
- UI sometimes refuses to open a window. A reload helps.

Raygun
I’ve decided to check Raygun mostly because of Scott Hanselman’s (it is even featured on the website) and Troy Hunt’s recommendations. Raygun, similar to New Relic, hides multiple services under its name. In this case, it’s Pulse and Crash Report. Pulse is available for: Android, iOS, maxOS, JavaScript, WordPress, Xamarin.Android and Xamarin.iOS. No .NET here so I will not be exploring this path. Crash report supports 27 options with most languages and platform covered(Ruby, Node, PHP, .NET, Go, ColdFusion and mobile). After playing with it a bit I can say that Raygun is not a tool I was looking for because it is focused on logs and crash reports, not on monitoring. That said it does it very well and has its place as a tool. How it works is that it will notify You when an error occurs and gives the possibility to mark it as fixed, but not deployed to prod. This will halt notifications of this type of errors. A simple feature, but a quite valuable one then managing production health and prioritizing bug fixes.
Raygun panel: 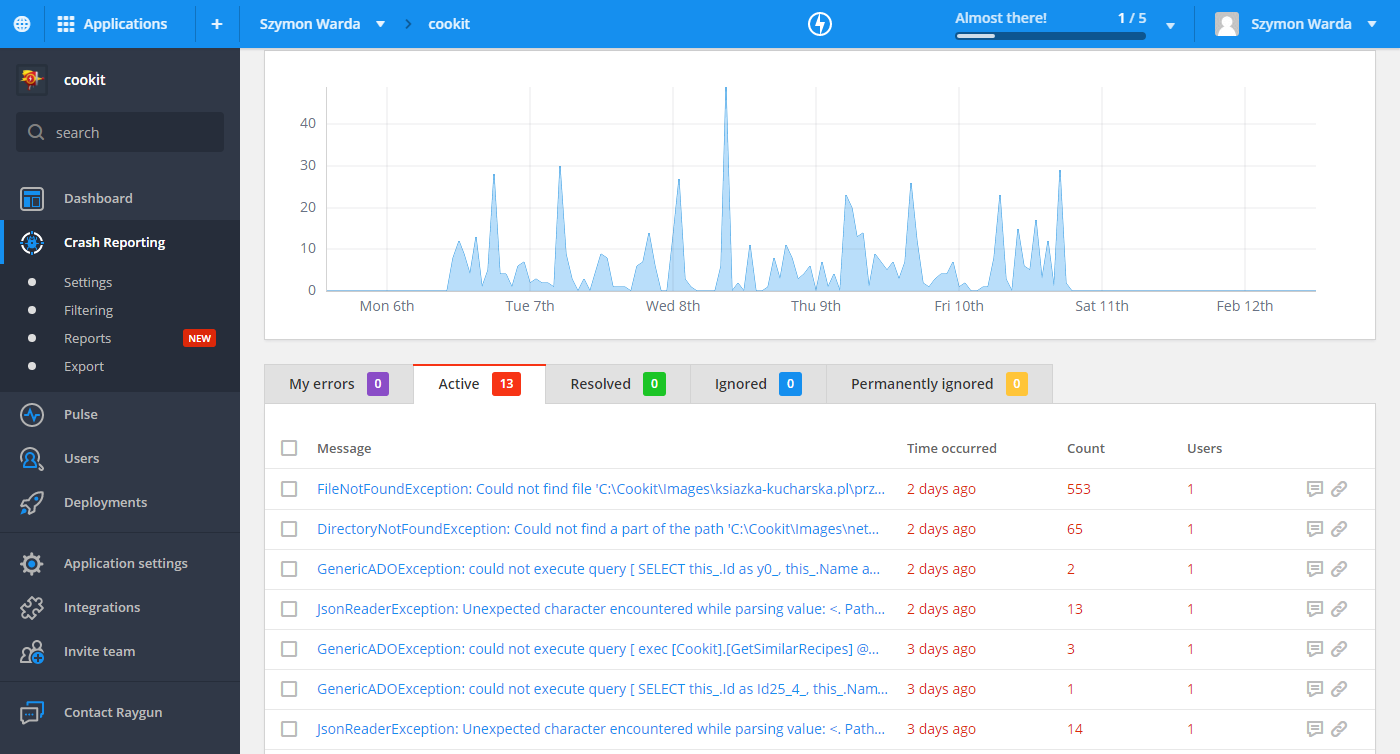
The good
- the logo reminds me of an old game Earthworm Jim, oh the memories…:)
- very carefully designed UI.
- easy to setup (NuGet package + web config changes)
- checking an error as fixed works good
- the filtering won’t let You filter on non-existing values. This prevents from misspelling the browser type for example. Small, but useful feature.
The bad
- at registration(demo) requires a phone number, company name, company size, and role.
- it is only a log aggregating mechanism
- the filtering has very little fields to work with

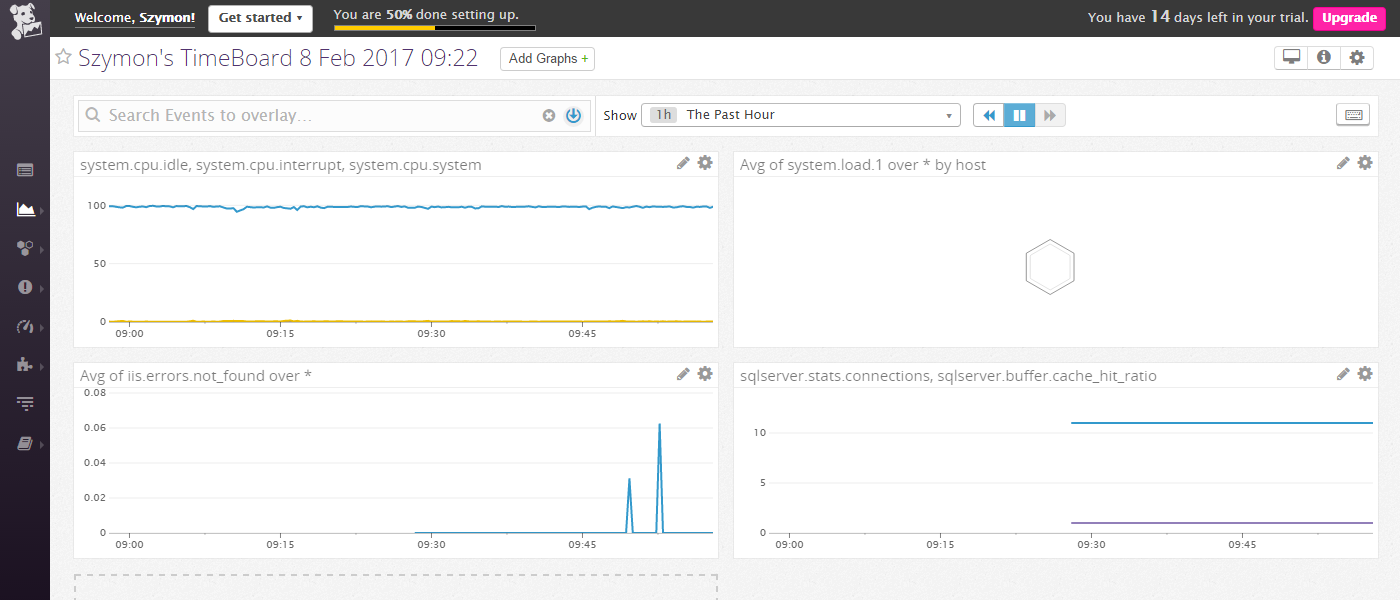
Datadog
I’ve heard earlier about Datadog, but never checked it before. The first impression was very good, but soon everything started going downhill (see the The bad section). It became clear quite fast that Datadog is targeted to administrators and people that need to have a big picture of servers and services that they have. This is a higher view than the application view I am looking for.
The good
- it can integrate with a huge number of systems (the only tool that could monitor Solr and Docker containers)
- when I finally managed to find a dashboard it looked really good.
- very customizable dashboard. Reminds me strongly of Grafana
- it has infrastructure map
- it has a free (with limited features) version up to 5 hosts.
The bad
- agent installation is strange. It is done by running the command in the command window and after it nothing happens. The stats started appearing after few minutes (~10), so I was already googling if anyone had a similar problem.
- agent after installation does the bare minimum. Its functionality can be extended by adding integrations on the website. This is the good part. What is not so nice is that adding a new feature requires changes the agent config, and other services, done manually on the server. This means a more configuration and no clean uninstall :( Retrace showed how to do it better.
- the configuration file (which You have to edit manually) is tab sensitive (??!!)
- no log aggregation
- to add an integration You have to: save the config file (edited in the agent), enable the monitoring and restart the agent.
- it took me way longer than I would wish for to get the SQL and IIS monitoring to work
Comparison table
| Service | Google Analytics | ELK + Graphite/Graphana | NewRelic | Retrace | Application Insights | Raygun | Data dog |
|---|---|---|---|---|---|---|---|
| Logging | |||||||
| Centralized logging | N | Y | Y | Y | Y | Y | N |
| Log querying | N | Y | S | Y | Y | N*9 | N |
| Custom log reports | Y | Y | S | Y | Y | N | N |
| Browser error collection | N | CbI*4 | Y | N | Y | N | N |
| APM | |||||||
| Server side performance | CbI | Y | Y | Y | Y | N | Y |
| Browser side performance | Y | CbI *4 | Y | N | Y | N | N |
| Environment performance | CbI | 3rd party tools *5 | Y | Y | Y | N | N |
| Custom metrics | CbI | Y | Y | Y | Y*7 | N | Y *10 |
| Alerts | N | Y | Y | Y | Y | N | Y |
| Real time view | Y | Y | Y | Y | Y | N | Y |
| Custom perf. reports | Y | Y | N | N | S | N | Y |
| Request dependencies details | N | N | Y | N | Y | N | N |
| Making life easier | |||||||
| Mobile access | Y *13 | 3rd party*6 | Y *13 | N | Works *2 | Y | S |
| OAuth | Y | N | N | N | N | Y | N |
| Features | |||||||
| Application map | N | N | Y | N | Y | N | N*11 |
| Price | Free with limists | 60$*14 | 150$*8 | 300$ | Free*3 | 588$ | Free*12 |
Legend:
- CbI - Can be implemented
- S - Sort of. Not fully supported, or with very few features.
- *2 - Azure portal is usable on mobile, but not a mobile first experience ;)
- *3 - Application Insights is free up to 1 GB per month. There is also a data cap and data sampling option, so staying in the limit is realistic.
- *4 - You have to implement the browser side and the proxy
- *5 - There are 3rd party tool available, although quality varies.
- *6 - there is An Android app Graphitoid for watching Graphite (did not try it). Kibana seems not to work on mobile
- *7 - Application Insights has three types of events: event (something happened), metric (something took x amount of time) and dependency (if auto detection didn’t see this one. Can also log time)
- *8 - New Relic’s pricing is not that straight forward. It is based on the type of a machine instance and hours it will run. This is the cheapest option I could find.
- *9 - it supports basic queries but doesn’t allow filtering on error text, so for me, it is a NO.
- *10 - if You log this metric as a performance counter Datadog can read it.
- *11 - there is only an infrastructure map.
- *12 - the free version doesn’t include alerts.
- *13 - dedicated app
- *14 - Kibana and Graphite is free, bit since I don’t want to install it on my server I have to fing a SaaS(hosted) offering. The cheapest I could find was Digital Ocean. Also, logz.io have a free offering up to 1GB
, but no [pricing](http://logz.io/pricing/) (?)the pricing widget appears on Edge and after disabling all add blockers and similar extensions.
What I’ve choose?
Remember I am looking for a tool that will be used in my side project. This means I will be spending my own money, and I don’t like to spend too much of it. The dislike for overspending is one of the main reasons I am running on crapp (it costs me ~320$ a year). So price will be important.
This said I will admit I have been blown away but what Application Insights offers and the pricing. I like that it is targeted to developers, still being very accessible. The pricing model is the best fitting for me since I can easily control if I want to pay and how much. There are still some things that would make me happier:
- Login with Google. This is the most popular OAuth account on the web and would make my life a bit easier. I get why this is not the option, but still.
- Faster UI. I don’t get the SPA idea in the portal. It is great when moving in scope of one module, but I would not mind a reload when going from the dashboard to AI
- More stable UI. Some windows open full screen, some open as a blade (internal Azure name). Sometimes they don’t open.
The second place goes to New Relic. It is expensive and not exactly what I am looking for, but if I had to report performance to nontechnical people this would be the service I choose. It is easy, nice looking (this is more important than You think) and yet manages to deliver just enough information to get a glimpse what is happening.
The third place goes to Retrace from Stackify. It has better alerts than the top two, but no single request analytics and that was the reason why it took the third place. Still, it is a very good tool. Another plus is that it has the option to mute an error similar to Raygun.
In the next entry - Application Insights configuration and architecture.