One of the main processes in cookit is dealing with extracting recipe information from raw html. I know it isn’t the most elegant solution but it is the only universal one.
But to the point.
Every web page goes through a process involving html parsing, stemming, parsing, and n-gram token matching. Then it’s saved to Sql Server and after transformation to Solr. So a lot of string manipulation, math calculations and from time to time mostly 0-gen GC.
In the most pessimistic case this process has to be re-run for every cached website for every page. And to give you a sense of how much data this is, here is the properties window for the folder containing the cached html files:
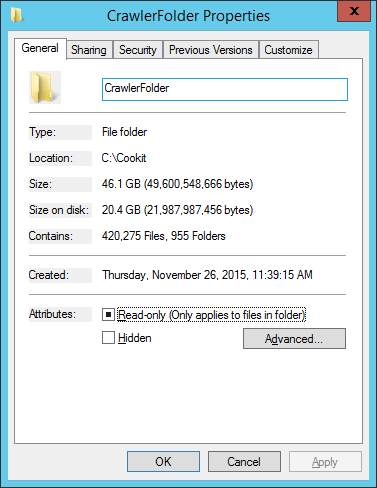
And since I run on crapp this process can take “a while”. And by that I mean days. It used to be more than a week but after a lot of work put into optimizations it takes now from 3 to 4 days for ~1000 websites.
I do optimization sessions from time to time, or when it feels necessary to. And when is that? There are some performance tests for some of the most critical parts, but the whole process is to complex to have a full blown performance test coverage. But this isn’t an issue since all background jobs are run in the background with Hangfire I get total run times out of the box and even better with a great dashboard:
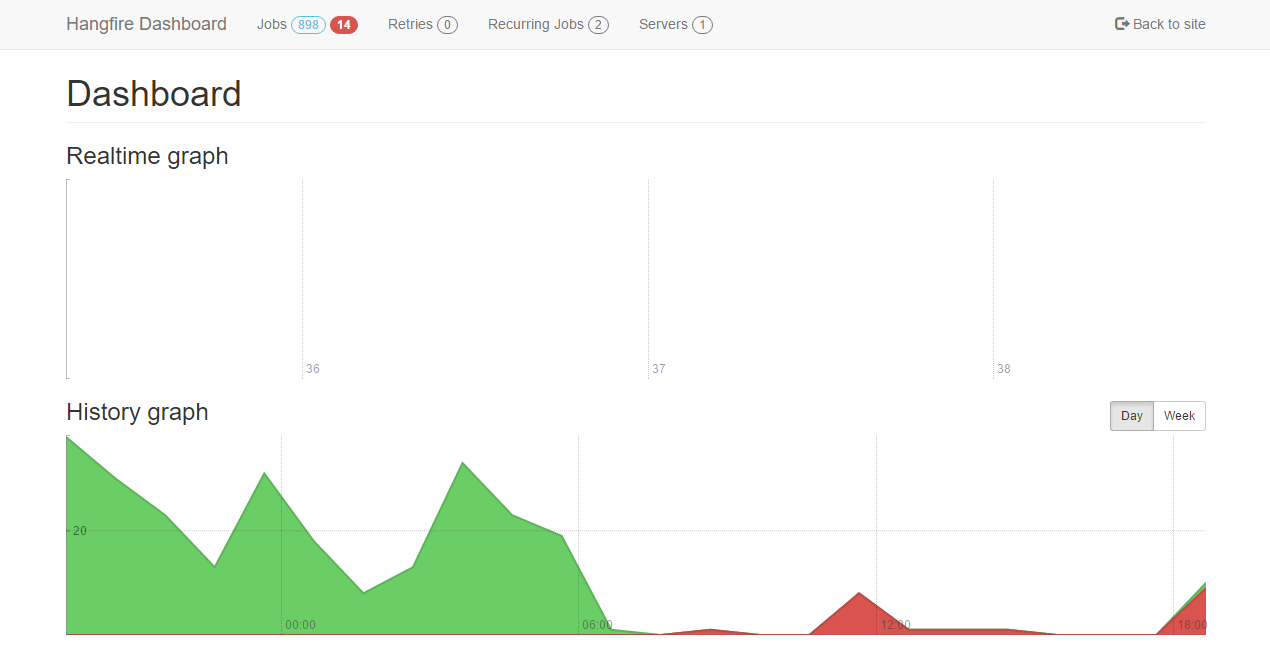
If those were parsing jobs being shown I would know that I have a big problem.
This will be a story of one of those “from time to time” sessions.
So lets begin and fire up Excel.

↑ This is probably the reaction of most people reading the above, but it is one of the most crucial steps in any optimization work.
Why?
- it gives an easy place where I note the run times and current tasks under tests.
- it can easily calculate means and any average function.
- since those runs usually last for a couple of minutes each in the meantime I do some reading, catching up with RSS feeds and so on. So when the run ends notes in excel let me easily switch context to the task currently under tests.
To be as close to the real run I fire it as a console application and go through the whole process. From reading the files, extraction, to saving to Sql Server and exporting to Solr. This is important because optimizations can speed up one fragment, but slow down the process as a whole.
This is what I saw in the base run :
- 98 sec
- 96 sec
- 130 sec
Now at this moment I could treat the third run as just a glitch, but I decided to do some more runs. And I saw this:
- 70 sec
- 69 sec
- 108 sec
- 106 sec
- 109 sec
This meant one thing - I have no baseline. The results had such a huge dispersion that they didn’t mean nothing.
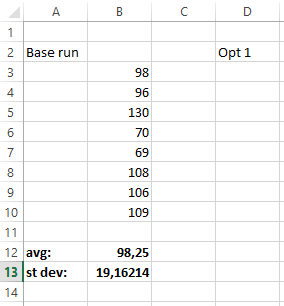
My Excel showed this:
Where:
-
avg is of curse the most common average - the arithmetic mean. And as anyone will tell you, it doesn’t mean anything without the second.
-
st dev is the standard deviation which shows how precise the average is. And in my case it is telling me it isn’t.
So I fired up the profiler at hand, witch was dotTrace and because I wanted a view what was going on I used the Timeline mode. I had to run it several times to catch the long run, but finally I’ve got it. And when I did here is what I saw: 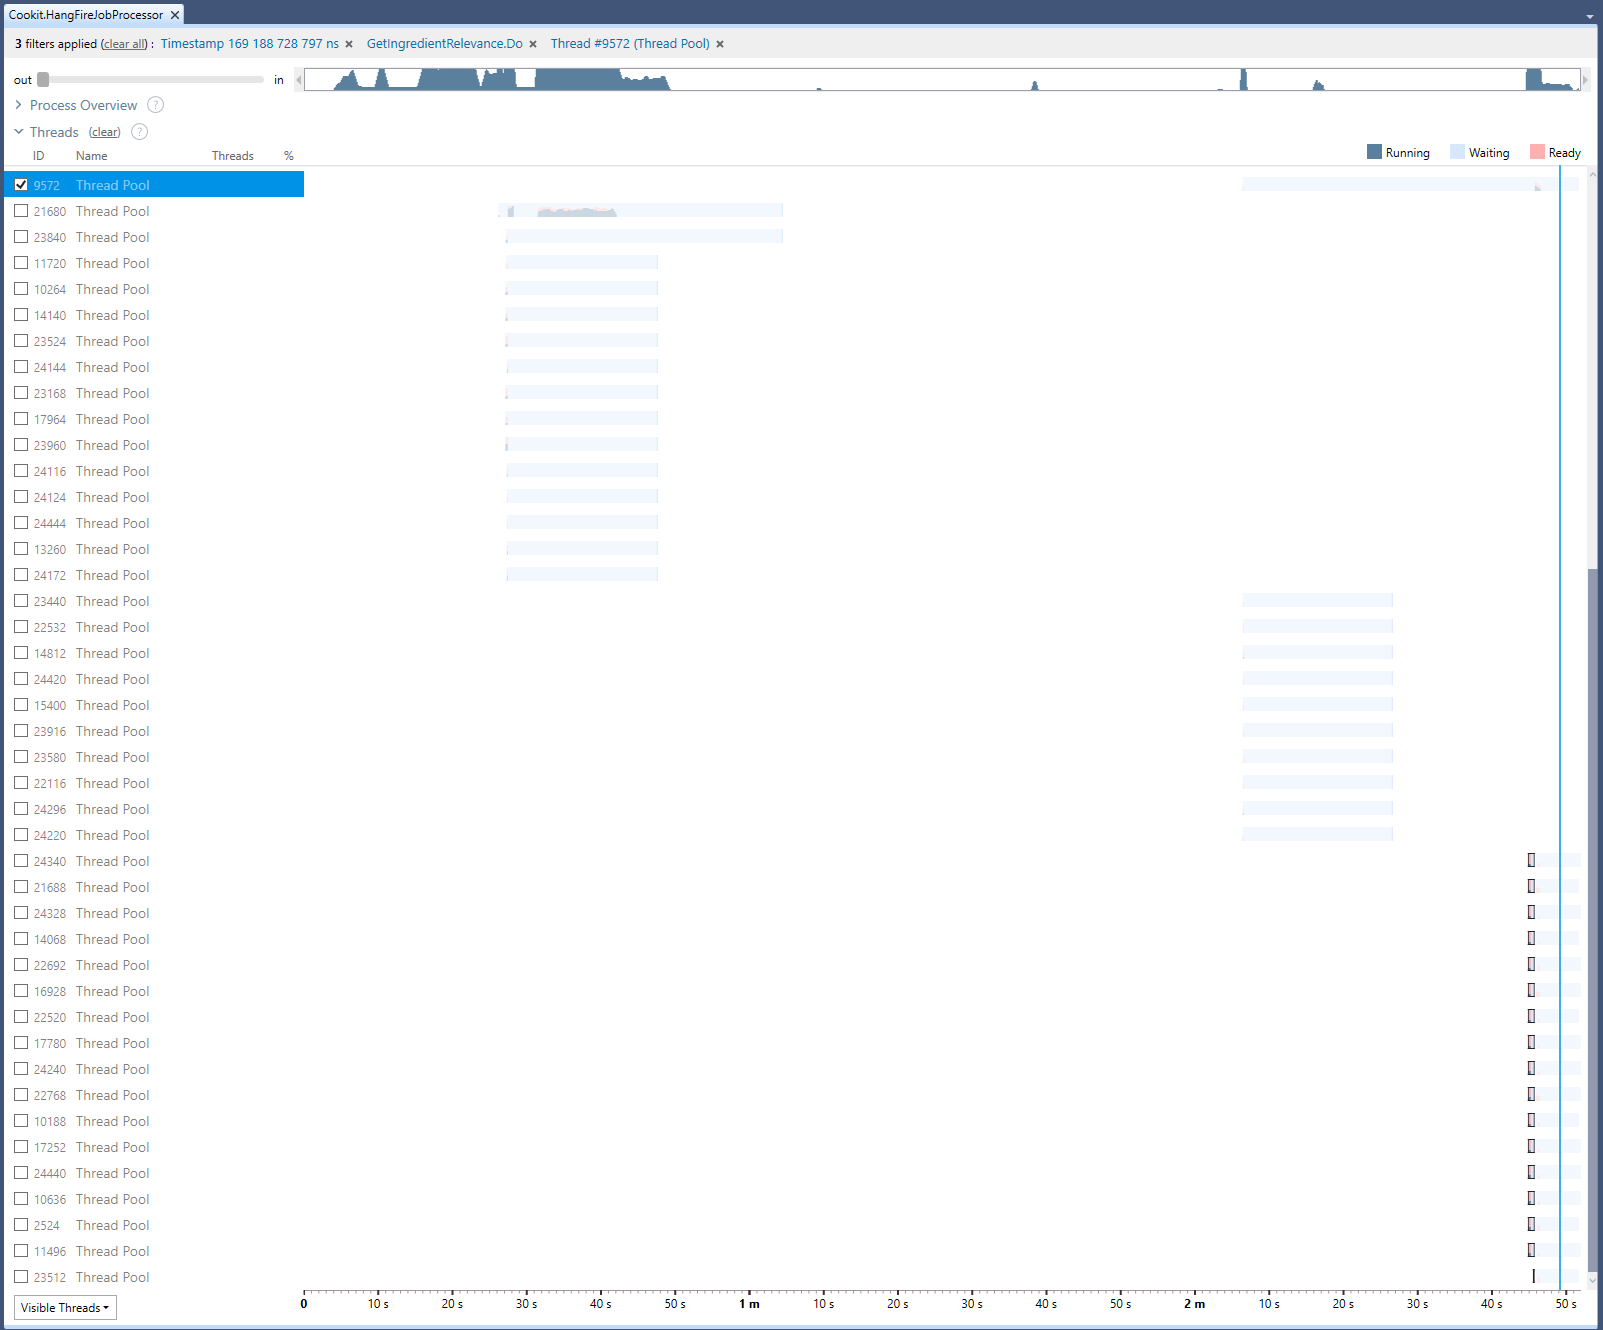
The main problem with this is that it is not showing a CPU bound process. But from Process Explorer I knew that all cores were hard at work. The second thing is that it shows a lot of threads doing almost nothing.
From the two above it was clear what to search for in the code.
This is the culprit:
return ingredients
    .AsParallel()
    .Select(a =>
        {
            float relevance = 1;
            if (_ingredientRelevance == null)
                _ingredientRelevance = _getIngredientRelevance.Do();
            if (_ingredientRelevance.ContainsKey(a.Id))
                relevance = _ingredientRelevance[a.Id];
            return new IngredientWithRelevanceAndLevel(a.Name, relevance, a.Level);
        }).ToList();
Because the profiler is showing only my code that means that the rest of the processing power was used to switch threads.
After removing the AsParallel my excel looked like this:
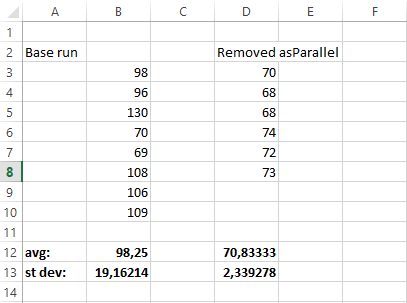
A lot nicer and a bit more predictable. So how did this change got through? It was a local optimization. It worked in a separated test, but when used in the whole process became a problem.
The Excel can be downloaded form here, and a Google Spreadsheet