This post is covering a subset of what I am talking in my talk How I stopped worrying and learned to love parallel processing (currently only in polish).
This will cover on how, in terms of performance, AsParallel can kick you in a place where it hurts a lot, simultaneously being a blessing in terms of… performance. How is that? Let’s look at some
History
AsParallel was introduced as an extension to LINQ with TPL in .NET 4.0. In theory, it’s God’s sent. The promise was that it will:
- parallelize the LINQ query.
- take care of all thread management and synchronization.
- adjust the number of Tasks automatically.
- not require any additional code changes except for
.AsParallel()
And in the vast majority of cases, this promise was kept! For example look at this code:
When it is awesome
void Main()
{
    //create a list
    const int _numberCount = 1*1000*1000;
    var list = new List<int>(_numberCount);
    for (var i = 0; i < _numberCount; i++)
    {
        list.Add(i);
    }
    //calculate in one thread
    MeasureTime(() => list
                        .Where(IsPrime)
                        .Count()
                );

    //use AsParallel
    MeasureTime(() => list
                        .AsParallel()
                        .Where(IsPrime)
                        .Count()
                );
}
//very bad way to calculate a prime. Not for production usage ;)
internal static bool IsPrime(int number)
{
    if (number == 1) return false;
    if (number == 2) return true;

    var boundary = (int) Math.Floor(Math.Sqrt(number));

    for (var i = 2; i <= boundary; ++i)
    {
        if (number%i == 0) return false;
    }

    return true;
}

private static void MeasureTime(Func<int> a)
{
    var sw = Stopwatch.StartNew();
    a();
    sw.Stop();

    Console.WriteLine("Took: " + sw.ElapsedMilliseconds);
}
This is a trivial example (a more real life example was published recently by Ayende here, here, here and here), but stay with me. In this case, the difference between single threaded and parallel execution is as follows:
Single threaded: 570
AsParallel: 138
This is more than 4-times speed up with only 1 line and no additional code changes. Looks like all the promises were kept.
But sometimes things don’t go that good.
AsParallel on a to small set
Let’s change that code, and set the list size to 100. Then the results will look like that:
Single threaded: 4
AsParallel: 15
And yes. Those numbers are tiny. But if you have it in every web request or a small that’s frequently called function it cumulates and affects overall performance. When talking about small functions they have a habit of being used in other functions, thus creating bigger blocks. Those blocks tend to be … parallelized. So let’s see what happens then.
Nested AsParallel
It is more or less the same code as above, but now we have:
CalcInSingleAsParallelthat calculates the primes usingAsParallel(same as above)’CalcInTwoNestedAsParallelsplits a list into chunks and returns in parallel callsCalcInSingleAsParallel
One thing to note about
CalcInTwoNestedAsParallelis that it splits the list into chunks when being invoked, but returns anIEnumerable. This trick defers the calculation of the prime untilCountis being called. This wayMeasureTimeonly measures the prime calculating part.
void Main()
{
    //create the list
    const int _numberCount = 1*1000*1000;
    var list = new List<int>(_numberCount);
    for (var i = 0; i < _numberCount; i++)
    {
        list.Add(i);
    }
    // split the list into 10 fragments and return an IEnumerable<IEnumerable<int>>
    var tenFragments = CalcInTwoNestedAsParallel(list, 10);
    MeasureTime(
                () => tenFragments.Sum(a => a.Count())
    );

    // split the list into 100 fragments and return an IEnumerable<IEnumerable<int>>
    var hundretFragments = CalcInTwoNestedAsParallel(list, 100);
    //calculate the prime number
    MeasureTime(
                () => hundretFragments.Sum(a => a.Count())
    );

    // split the list into 1000 fragments and return an IEnumerable<IEnumerable<int>>
    var thousandFragments = CalcInTwoNestedAsParallel(list, 1000);
    //calculate the prime number
    MeasureTime(
                () => thousandFragments.Sum(a => a.Count())
    );
}
private static IEnumerable<IEnumerable<int>> CalcInTwoNestedAsParallel(List<int> numbers, int chunkNumber)
{
    var numbersChunks = ToChunks(numbers, chunkNumber);
    return numbersChunks
        .AsParallel()
        .Select(CalcInSingleAsParallel)
        ;
}
private static IEnumerable<int> CalcInSingleAsParallel(List<int> numbers)
{
    return numbers
        .AsParallel()
        .Where(IsPrime)
        ;
}

private static List<List<int>> ToChunks(List<int> source, int nSize = 30)
{
    var ret = new List<List<int>>();
    for (var i = 0; i < source.Count; i += nSize)
    {
        var tmp = source.GetRange(i, Math.Min(nSize, source.Count - i));
        ret.Add(tmp);
    }
    return ret;
}
internal static bool IsPrime(int number)
{
    if (number == 1) return false;
    if (number == 2) return true;

    var boundary = (int) Math.Floor(Math.Sqrt(number));

    for (var i = 2; i <= boundary; ++i)
    {
        if (number%i == 0) return false;
    }

    return true;
}
private static void MeasureTime(Func<int> a)
{
    var sw = Stopwatch.StartNew();
    a();
    sw.Stop();
    Console.WriteLine("Took: " + sw.ElapsedMilliseconds);
}
The results look like this:
For 10 chunks containing 100 000 elements it took: 1737
For 100 chunks containing 10 000 elements it took: 361
For 1000 chunks containing 1 000 elements it took: 228
We have a ~7.6 times difference between the best and the worst run, and ~12.5 times difference when compared to a single AsParallel! It gets even worse when we nest it into another AsParallel (while maintaining the same total amount of calculations being done):
For 10*10 chunks containing 10 000 elements it took: 3061
For 100*100 chunks containing 100 elements it took: 571
For 1000*1000 chunks containing 1 elements it took: 284
Take a look again at the last line: For 1000*1000 chunks containing 1 elements it took: 284 It was the fastest in this run although having very tiny (one element) lists.
The difference between the best and the worst run is this case is 11 times. When compared to the best run (a single AsParallel) it is more than 22 times slower! Why is that?
The profiler
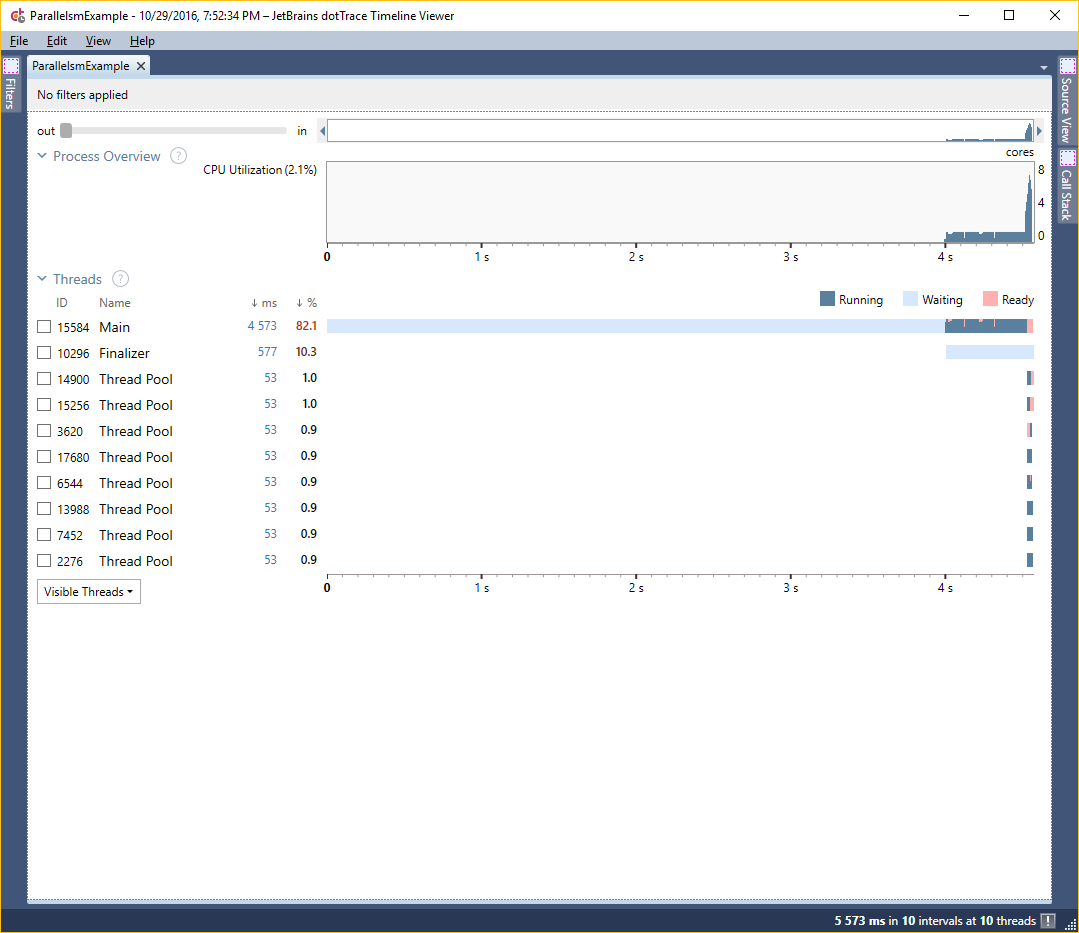
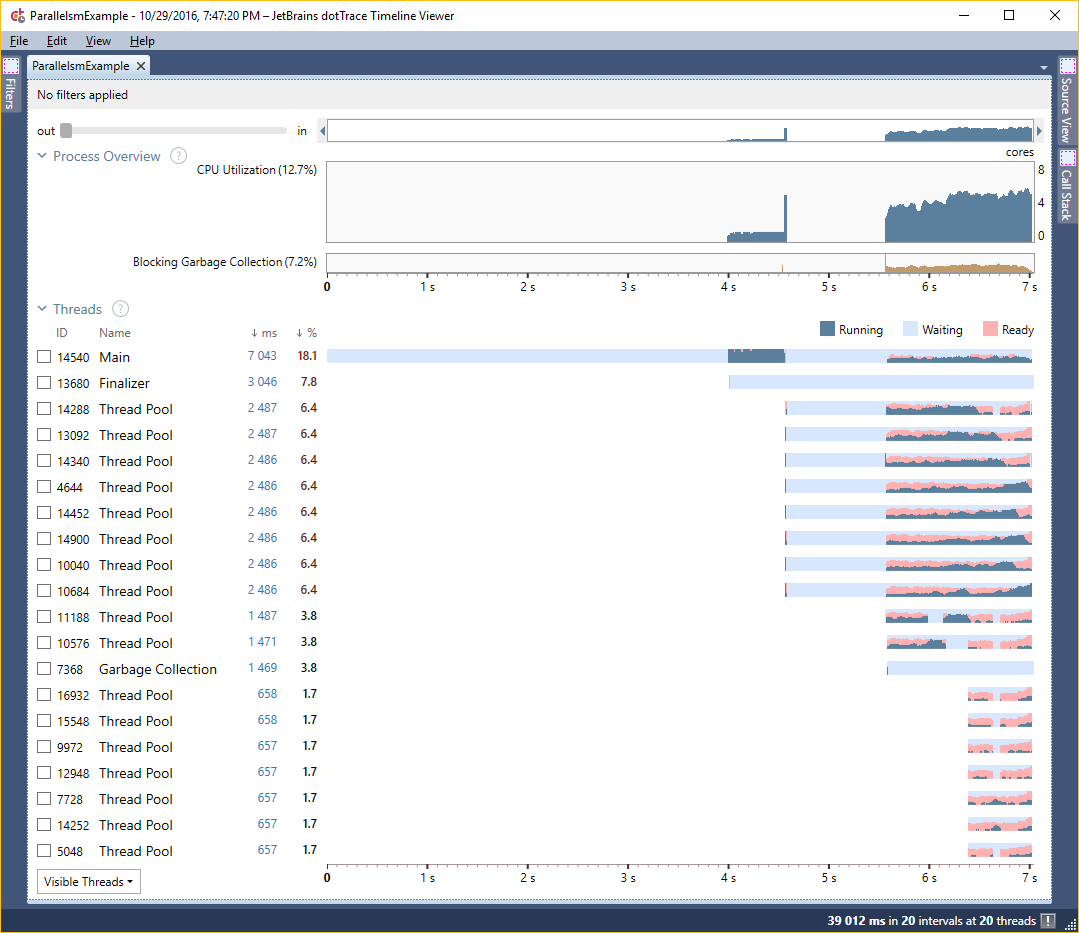
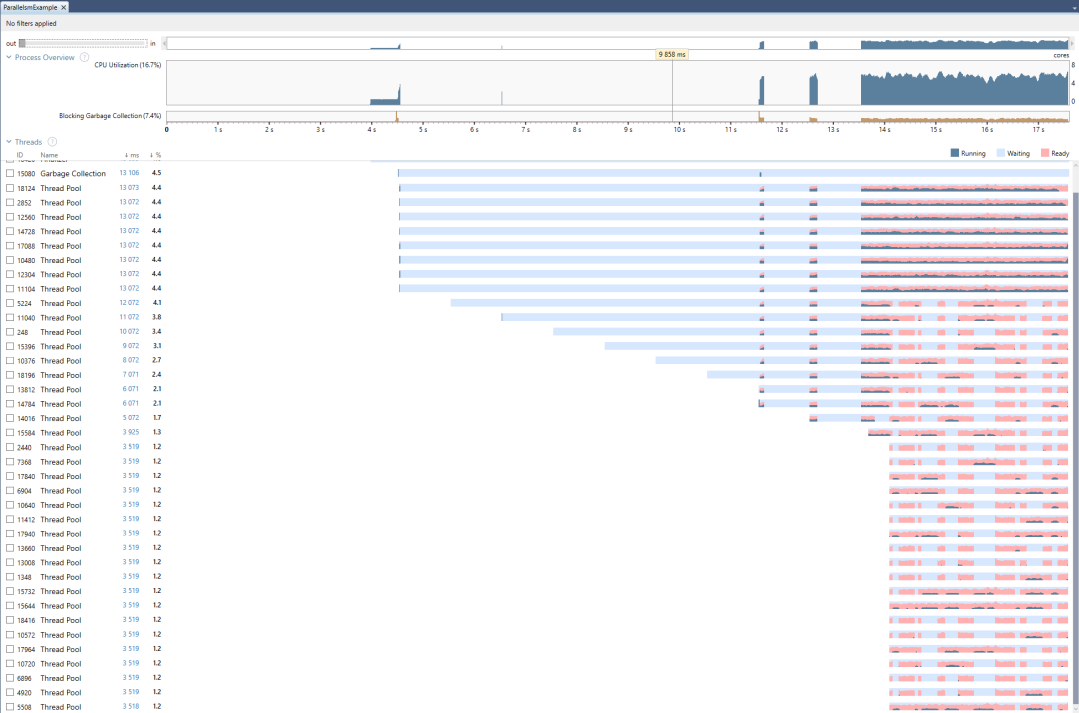
This is the dotTrace result for all of the above:
No nesting, single AsParallel: 
One nesting (so two AsParallel), 10 chunks: 
Two nestings (so three AsParallel), 10*10 chunks: 
So what is happening in those applications?
The first thread is the main thread of the application. The long delay before spawning more threads is the start-up of the application and list creation. Next threads start to show up. This is because of the call to AsParallel. It triggers TPL’s TaskScheduler which tries to create just the right amount of threads to minimize context switching between them and, at the same time, parallelize as much as possible by assigning tasks to thread and if needed creating more threads.
So why do we have such huge difference in execution times? Then we compare the images, the answer what is wrong becomes obvious. The cost is hidden in switching and managing threads. TPL’s task scheduler is creating new threads and assigning tasks to them because it thinks adding more will help (a single operation is short). At the same time, the operating system is switching between threads, trying to give each a slice of processors time thus reducing the time real computation is being done. Those two managers are interfering each other leading to almost no work being done and in the end a 22 times increase in time needed for the work to finish.
This shows that micro-managing is not a good thing. In programming or in the real world ;)
Conclusion
AsParallel gives mind blowing performance gains with little to none effort. But it can’t be treated as a silver bullet. When you decide to use it:
- profile the whole process.
AsParallelis dependent on the data size. So have performance tests with wide range of size of the processed data- when used in a web application, test it under load. IIS likes to have control over threads and you are messing with it.
Use with caution