One of the steps in cookit is calculating similar recipes. This is what you can see on the left on the recipe page like this
For the sake of clarity and manageability it’s scheduled as separate Hangfire jobs. Because cookit is running 5 workers, so similarities are calculated for 5 websites concurrently.
The process uses cosine similarity, so it allocates a huge list at start and calculates similarities. A very CPU heavy operation.
So some time after triggering all recipes recalculation I saw this in Hangfire console. 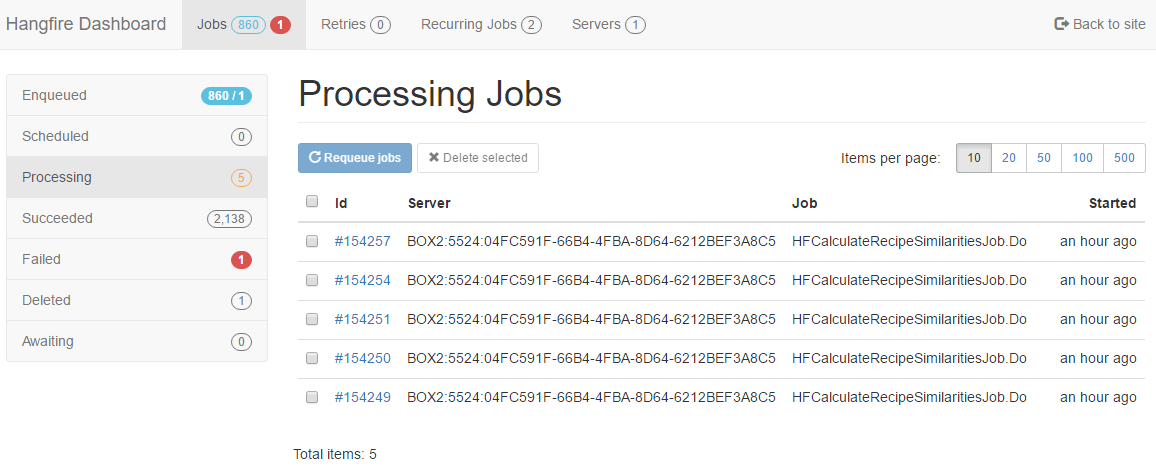
The process can take a while, but on average it lasts couple of minutes. First thing was to check was if the server was doing anything. So fire up Task Manager and here it is:
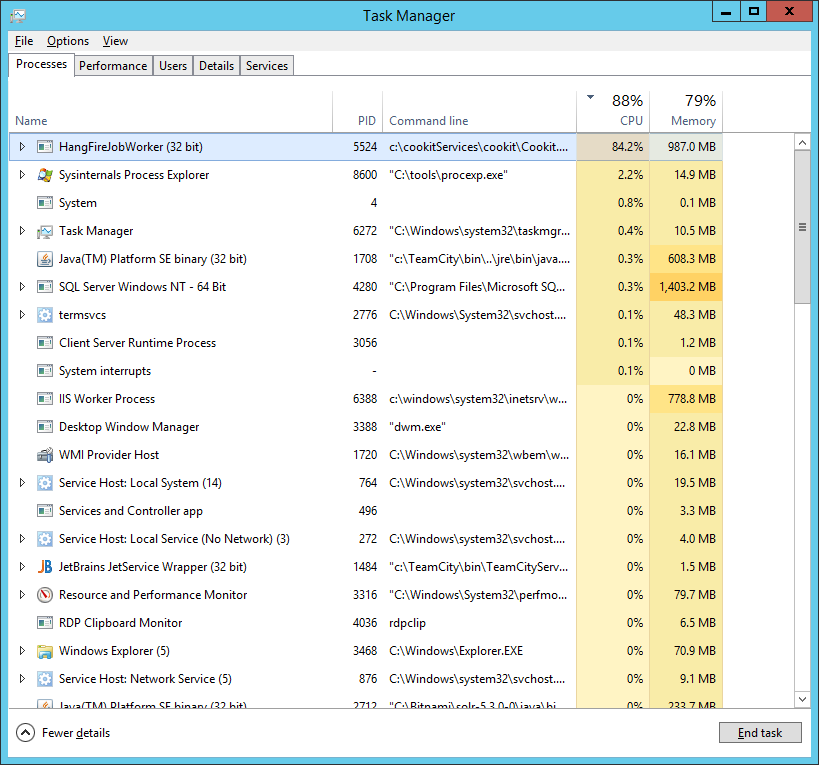
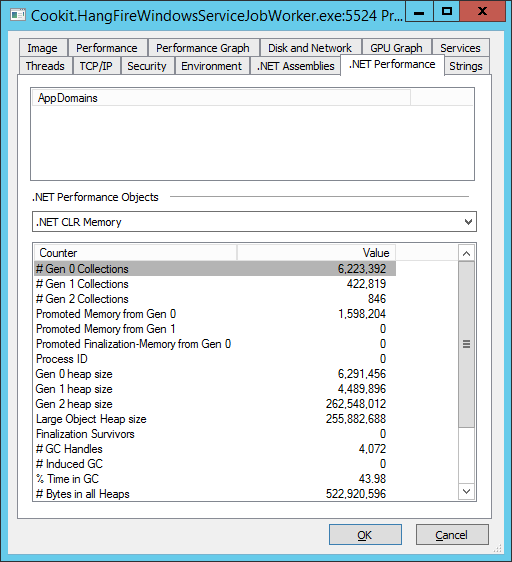
So, something is happening. To better know what, I’ve fired up Process Explorer(run it as administrator!) and in the Properties > .NET Performance tab I saw this.
A side note.
Process Explorer is an element of Sysinternals Suite. This is the must have for any developer using Windows. They don’t need installation and weight less than 16MB. I always place them under C:\tools
I really like this tab, because it shows all the main performance counters for .NET programs. And in this case it also worked. Spending 43% (in the peeks) in GC is not a good thing.
Just to be sure that high GC isn’t caused by another issue, like exceptions let’s look at .NET CLR Exceptions tab:
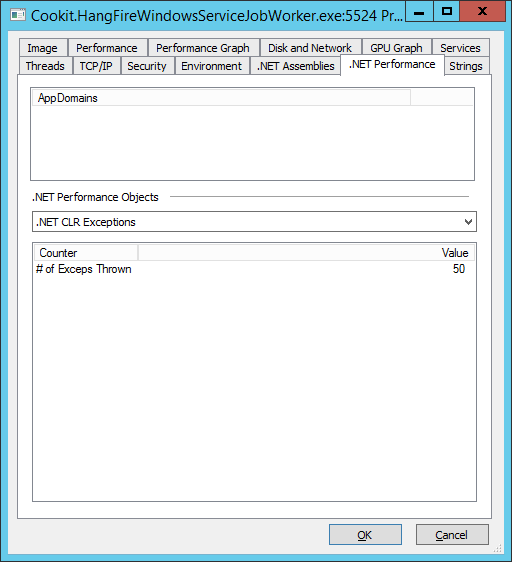
More than I would want, but:
- those are all exceptions thrown during the lifetime of the process and earlier it has done some extraction jobs and they can cause exceptions.
- those are also first level exceptions. So also the caught ones. Some libraries use exceptions as way to control logic, and this can be seen on this tab. It can be a major performance hit.
- under heavy load Hangfrie can throw some sql timeout exceptions.
Process Explorer only shows snapshots. To see how it looks over time fire up Performance Monitor (perfmon.exe - it is installed on every Windows) and add .NET CLR Memory % Time in GC performance counter (using the green plus).

Well it looks really bad. To say the least.
This only gives a very high level view. To have a better look let’s add more performance counters:
- .NET CLR Memory # Gen 0 Collections (how many times Gen 0, Gen 1 and Gen 2 collection was called. It is a sum of all Gen collections count not only Gen 0)
- .NET CLR Memory \ # Gen 1 Collections (Sum of Gen 1 and Gen 2 collections called.)
- .NET CLR Memory \ # Gen 2 Collections
- .NET CLR Memory \ % Time in GC
and we see this:
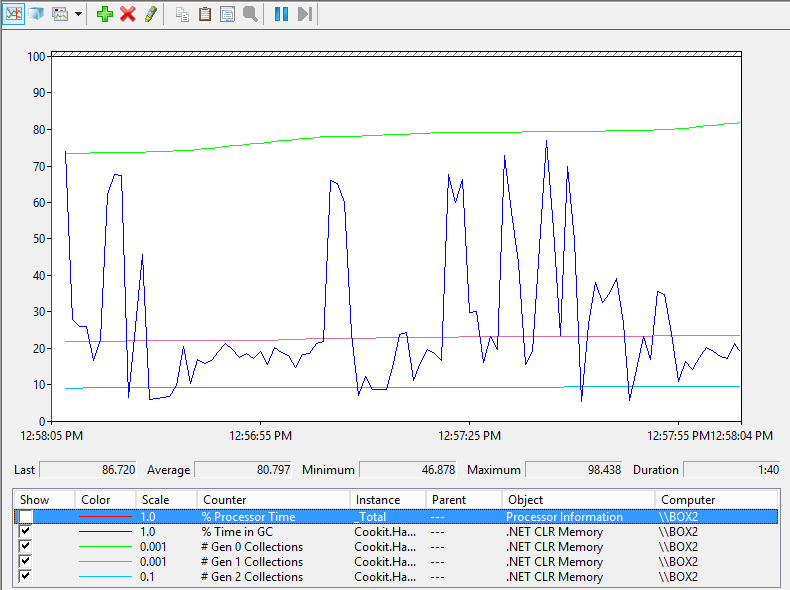
So a lot of Gen 0 and Gen 1 collections, plus a little bit of Gen 2.
This is showing that .NET is under memory pressure and it’s trying to free memory. Because it’s not running a lot of Gen 2 collections means that enough memory is being freed during Gen 0 and 1.
To be sure lets see how big Gen 0 and 1 heaps are (how much memory is allocated on them), and how they behave over time. Lets have a look at those counters:
- .NET CLR Memory \ # Gen 0 heap size
- .NET CLR Memory \ # Gen 1 heap size
- .NET CLR Memory \ # Gen 2 heap size
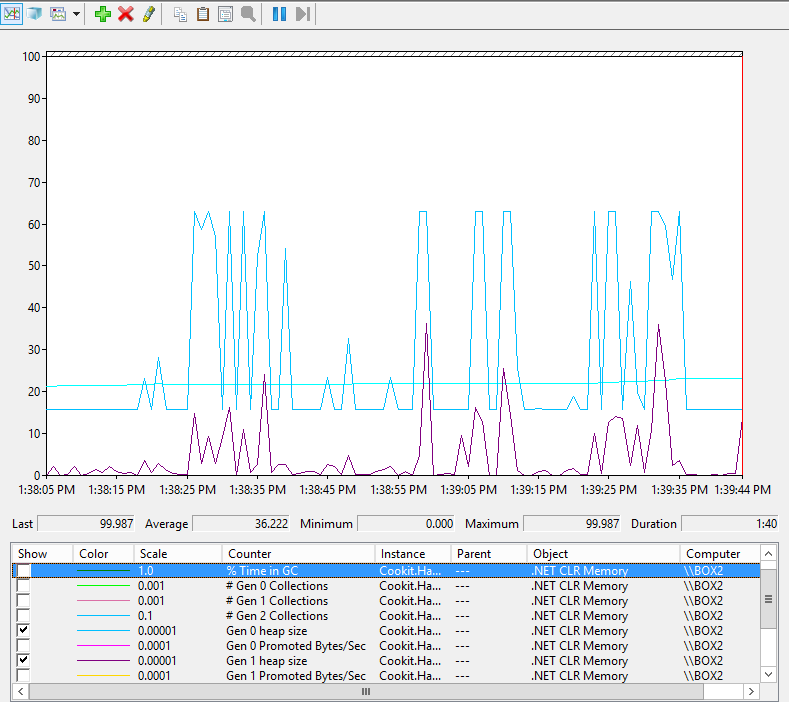
This almost what I expect how the process would use memory:
- It allocates a huge list at start (the Gen 0)
- It loops through every recipe, calculates similarity, and stores it in a sorted list. The list is limited to five top similarities. So a lot of objects are being moved into and from the list.
So were is the almost?
Most allocated object should have a short life span, so they should be collected cheaply in Gen 0. But because Gen 1 is this big it means that when GC is triggered it can’t collect them, so they are being moved to Gen 1. Then Gen 1 collection is being triggered, and previously moved objects are being collected. And Gen 1 collection is far more costly. In summary GC is being triggered too often.
To show my point where is the Performance Monitor with only one worker.
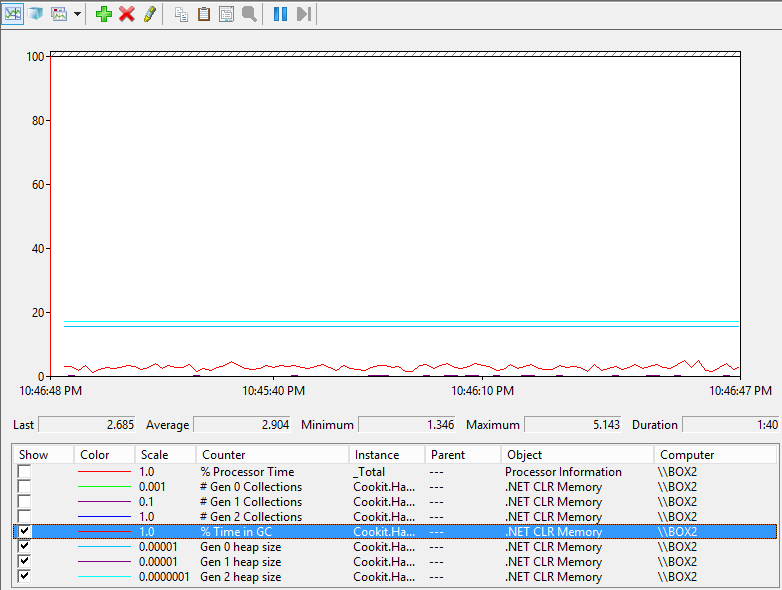
You may be wondering where is the Gen 1 line?
It is still there. It’s those few pixels just above the 0 line is the Gen 1 heap size. And this is the same scale as plot above.
To make a point I’ve added time in GC.
A very boring plot. Just as it should be.
But this only shows the problem. Possible solutions are:
- Get a better machine with more RAM. This is out of the question, as I already explain why cookit runs on crap
- Have one worker. This is also not a good solutions because some jobs are I/O (network) bound. And having one worker is in general not that good (anyone remembers 1 core processors?)
So how to have differentiate the number of workers in Hangfie?
This will be in the next post :)